Abstract
A claimant who appeals a denied Social Security disability claim is assigned, essentially at random, to an administrative law judge (ALJ) within a hearing office. Using the Social Security Administration's public ALJ disposition files for fiscal year 2025, I measure how much that assignment matters. Among 1,023 judges who issued at least 100 decisions in a single office (317,462 decisions in total), allowance rates ranged from 8.8 percent to 92.8 percent. The disparity is not primarily geographic: 73 percent of the variance in judge allowance rates lies within hearing offices rather than between them, and in the median office the gap between the most and least generous judge is 32.6 percentage points. A simulation in which every judge in an office decides identical case pools shows that sampling noise can account for only about 5 percent of the observed within-office variance. Judge allowance rates are also highly stable across years (r = 0.93 between FY2025 and FY2026 year-to-date), which rules out one-off docket composition as an explanation. Office-level workload measures (average processing time, backlog per disposition) explain little of either the level or the spread of allowance rates, and a state-month panel of initial-level determinations from 2015 to 2026 shows only a small association between backlog pressure and allowance rates. The judge draw remains one of the largest observable determinants of whether a disability appeal succeeds, a decade after the agency's quality-review reforms.
1. Introduction
Social Security disability benefits are adjudicated in stages. A claim denied at the initial and reconsideration levels by a state Disability Determination Service (DDS) can be appealed to a hearing before an administrative law judge. The hearing stage is where many claims are ultimately won or lost: several hundred thousand cases are decided there each year, and for most claimants it is the last realistic stop, since Appeals Council review and federal court reverse comparatively few outcomes.
Within a hearing office, incoming cases are assigned to judges by rotation, without regard to the merits of the case. That institutional detail turns each hearing office into a natural experiment. If judges in the same office face comparable case pools, then persistent differences in their allowance rates measure something about the judges rather than the cases.
Concern about inter-judge disparity in this system is not new. Krent and Morris (2013), in a study for the Administrative Conference of the United States, documented substantial inconsistency across judges and proposed reforms. The Government Accountability Office (2017) found that allowance rates could vary by as much as 46 percentage points for a typical claim depending on the judge, after controlling for claimant and judge characteristics, though it also reported that variation had declined modestly between 2007 and 2015 as the agency expanded quality review and training. Ramji-Nogales, Schoenholtz, and Schrag (2007) found the same structure in asylum adjudication and gave the phenomenon its name, refugee roulette.
This paper asks a simple question: where does inter-judge disparity stand now? It uses only public data published by the Social Security Administration itself, which means every number here can be recomputed by anyone with a browser. Three features distinguish the analysis. First, it isolates the within-office component of disparity, the part that geography, regional economics, and local case mix cannot explain. Second, it quantifies how much of the observed spread could be produced by chance alone, using a simulation calibrated to each judge's actual decision volume. Third, it tests whether judge allowance rates persist into the following fiscal year, which separates stable judge propensities from one-year docket accidents.
2. Data
All data come from the Social Security Administration's public data files.
ALJ Disposition Data. The Office of Hearings Operations publishes, for each fiscal year, a file listing every ALJ, the hearing office(s) in which they decided cases, and counts of dispositions, decisions, awards, denials, and fully or partially favorable decisions. I use the complete FY2025 file (the September 2025 cumulative report, 1,438 judge-office rows) and the FY2026 year-to-date file retrieved in July 2026 (1,228 rows).
Hearing office workload files. The FY2025 Hearing Office Workload Data and Average Processing Time reports provide, for each of roughly 160 hearing offices, annual receipts, dispositions, pending cases, and average processing time in days.
State Agency Monthly Workload Data. For the secondary analysis of the initial (DDS) level, I use SSA's state-month panel of initial determinations, allowances, and pending counts, which covers October 2000 through May 2026; I restrict to January 2015 onward (7,603 state-months across 57 jurisdictions).
Sample construction. The unit of analysis is the judge-office cell. I drop the Special Review Cadre, which is not a geographic office with rotational assignment, and keep cells with at least 100 decisions in FY2025 to limit small-sample noise. This yields 1,065 cells covering 1,023 judges and 317,462 decisions. The main allowance rate is awards divided by decisions, which excludes dismissals; results using all dispositions as the denominator are reported as a robustness check. For office-level statistics I require at least four qualifying judges per office, leaving 148 offices.
A limitation worth stating plainly: the public files do not contain case-level covariates, so "random assignment within office" is an institutional fact about SSA's rotational docketing rather than something I can verify claim by claim. Judges who hear video dockets drawn from other regions, or who sit in multiple offices, could face different case pools. Section 5 shows the results are unchanged when National Hearing Center offices and itinerant judges are excluded.
3. The distribution of judge allowance rates
Figure 1 shows the FY2025 distribution. The mean judge allowed 58.3 percent of decided cases, but the spread around that mean is wide: a standard deviation of 14.3 points, a 5th percentile of 33.8 percent, and a 95th percentile of 81.7 percent. At the extremes, one judge with over 100 decisions allowed 8.8 percent of them; another allowed 92.8 percent.
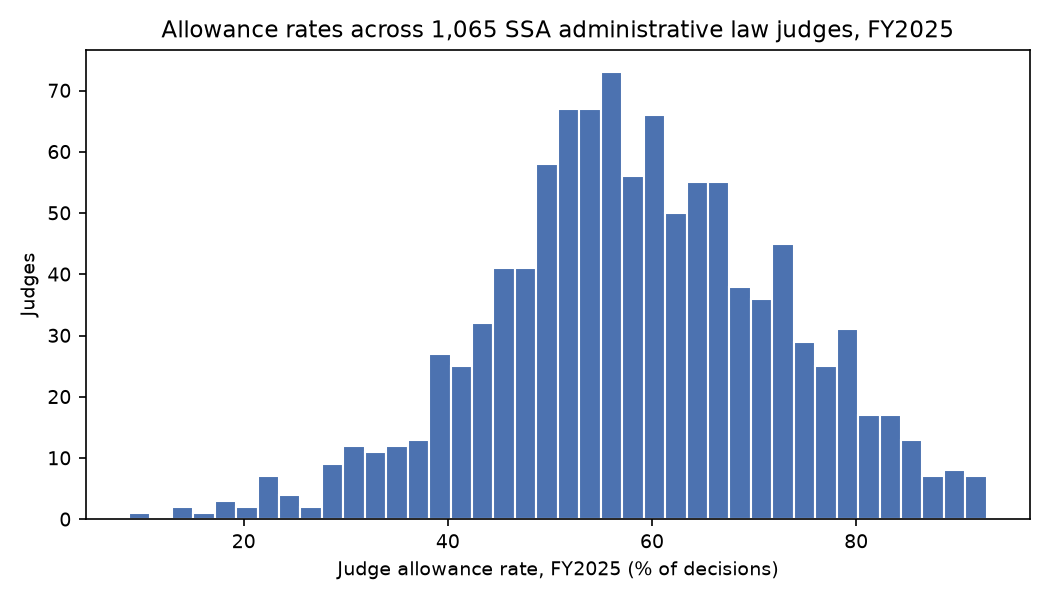
Averaged over the whole system, then, the identity of the judge is associated with swings in the probability of award that dwarf most things a claimant or representative can control. But the national distribution mixes two sources of variation: differences between offices (which could reflect real differences in regional case composition) and differences within them (which, under rotational assignment, cannot).
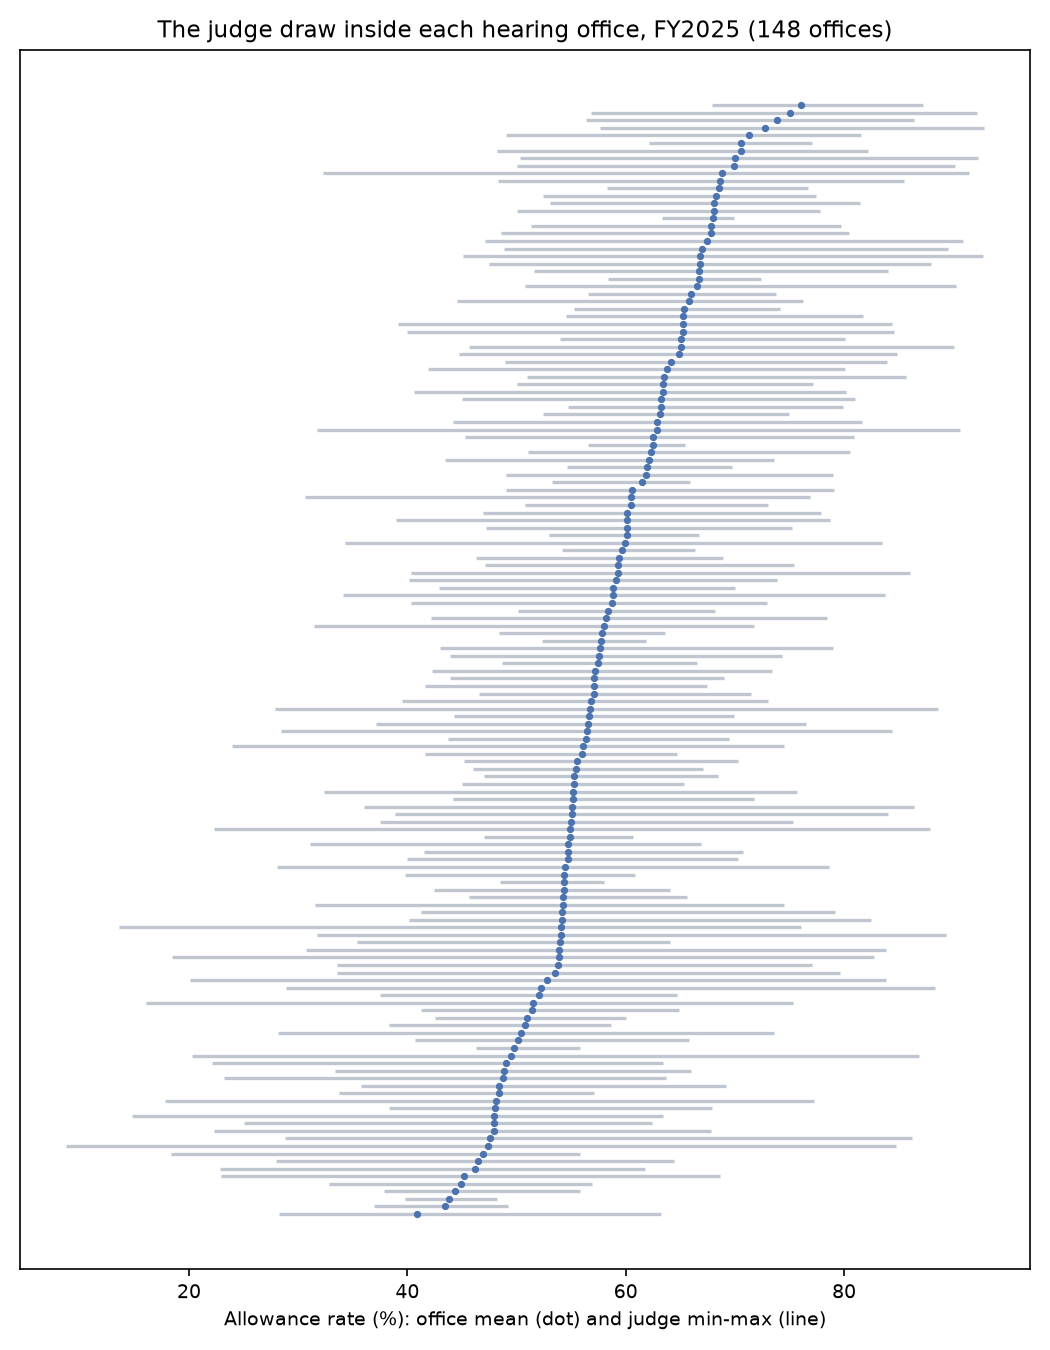
Decomposing the variance settles the question of which dominates. Only 27 percent of the variance in judge allowance rates lies between hearing offices. The remaining 73 percent is within-office: judges down the hall from one another, drawing from the same queue, deciding at very different rates.
Figure 2 makes this concrete. Each row is a hearing office, showing the office mean and the span from its lowest to highest judge. In the median office the max-min gap is 32.6 percentage points. Gaps exceed 20 points in 84 percent of offices and 30 points in 58 percent. In the most divergent office in the sample, colleagues ranged from 8.8 percent to 84.8 percent.
4. Is it noise? Is it the docket?
Sampling noise. With around 300 decisions per judge, some spread is expected by chance. To quantify how much, I simulate a null world in which every judge decides cases drawn from their office's pooled allowance rate, with each judge's actual FY2025 decision count. Across 2,000 simulations, the null within-office standard deviation averages 2.8 points (99th percentile 3.0), against an observed 12.3 points, and the null median within-office range is 7.7 points (99th percentile 8.3) against an observed 32.6. Chance can produce about 5 percent of the observed within-office variance. The other 95 percent is systematic.
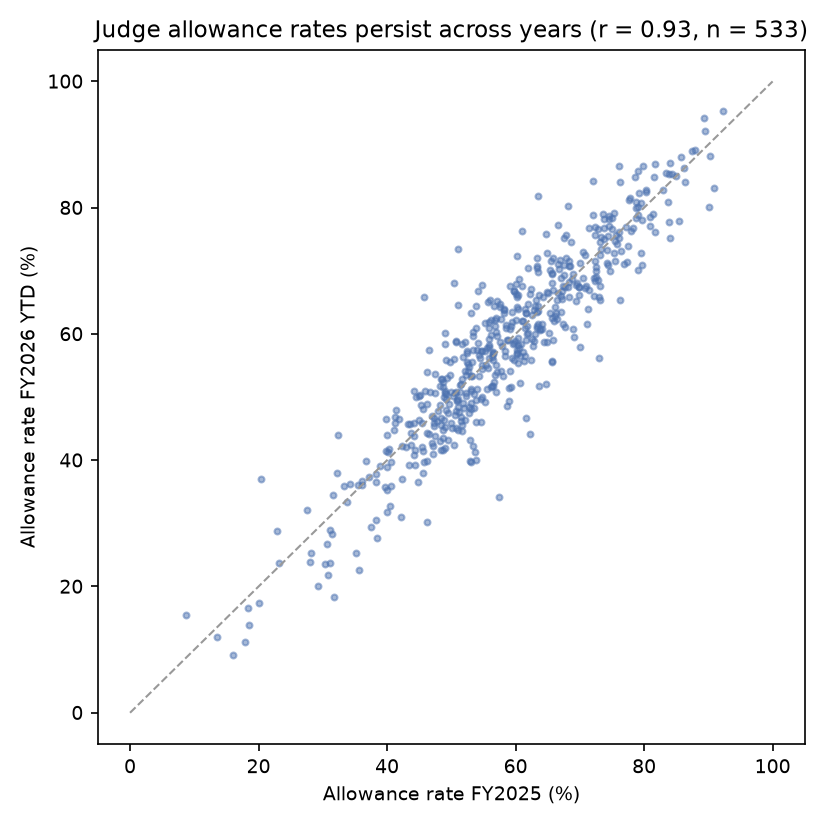
Docket composition. If a judge's high or low year reflected an unlucky draw of cases rather than a stable propensity, rates would regress heavily toward the office mean the following year. They do not. For the 533 judge-office cells with at least 100 decisions in both FY2025 and FY2026 year-to-date, the correlation between the two years' allowance rates is 0.93 (Figure 3).
Workload pressure. One might expect overloaded offices to decide differently, in either direction: faster grants to clear queues, or harsher screening under pressure. The data show little of either. Across 143 offices, average processing time is only weakly correlated with the office's mean allowance rate (r = 0.16, p = 0.055), backlog per disposition is not correlated with it (r = 0.07, p = 0.43), and neither predicts the within-office spread (r = 0.02, p = 0.83). The secondary panel at the initial level points the same way: with state and month fixed effects, a one-month increase in a state DDS's backlog-to-determinations ratio is associated with a 0.18 percentage point increase in the initial allowance rate (r = 0.18, n = 7,603). Statistically detectable, substantively minor. Disparity in this system is not a workload story. It is an adjudicator story.
5. Robustness
The within-office disparity estimates barely move under any reasonable perturbation of the sample.
| Specification | Judge-office cells | Offices | Median within-office range | Median within-office SD |
|---|---|---|---|---|
| Baseline (≥100 decisions, ≥4 judges) | 1,065 | 148 | 32.6 pts | 12.1 pts |
| Excluding National Hearing Centers | 1,033 | 143 | 32.6 | 12.1 |
| Excluding itinerant judges (<50% of their decisions in office) | 1,021 | 146 | 32.6 | 12.1 |
| Minimum 200 decisions | 855 | 117 | 32.1 | 12.1 |
| Allowances / all dispositions (incl. dismissals) | 1,065 | 148 | 28.9 | 10.7 |
National Hearing Centers, whose video dockets could plausibly differ from walk-in dockets, do not drive the result. Neither do judges splitting time across offices, nor the volume threshold, nor the choice of denominator.
6. Discussion
Ten years after the reforms that GAO (2017) credited with a five-point reduction in inter-judge variation, the within-office gap between the most and least generous judge in a typical hearing office is still larger than 30 percentage points, and a judge's rate is nearly perfectly persistent from one year to the next. For the claimant, the practical meaning is simple: conditional on reaching a hearing, the random draw of an adjudicator shifts the probability of award by more than most observable features of the case.
Two interpretations deserve separating. One is legal-realist: disability determination at the margin involves genuine judgment about pain, credibility, and residual capacity, and reasonable adjudicators will disagree. Some dispersion is the price of individualized hearings. The other is institutional: dispersion this large and this stable, with no connection to workload, looks less like case-by-case judgment and more like judges applying systematically different de facto standards. The persistence result cuts toward the second reading. Random disagreement about hard cases would not reproduce itself at r = 0.93 across years.
The data cannot say which judges are right. A 30-point gap is consistent with the strict judge wrongly denying meritorious claims, the generous judge wrongly granting weak ones, or both. What the data do say is that the outcome of a disability appeal depends, to a degree that has resisted a decade of quality-review machinery, on which name comes up in the rotation.
There are policy margins worth studying with better data than the public files allow: whether targeted review of outlier judges (in both directions) compresses the distribution, whether the composition of dismissals differs across judges in ways that the decision-based rate misses, and whether representation interacts with the judge draw. All would require case-level data. But the headline fact requires nothing beyond the agency's own published tables, and it seems underappreciated in public discussion of a program that decides several hundred thousand appeals a year.
7. Conclusion
In fiscal year 2025, judges within the same Social Security hearing office, drawing cases from the same rotational queue, allowed disability claims at rates that commonly differ by more than 30 percentage points. Sampling noise explains about one-twentieth of this. Year-to-year persistence is near unity. Workload explains almost nothing. Whatever else has changed in disability adjudication over the past decade, the judge lottery has not closed.
Data and code availability
All datasets are published by the Social Security Administration at ssa.gov (OARO/OHO Public Workload Data Files; State Agency Monthly Workload Data). The full extraction and analysis code, and the exact snapshots used, are available at https://github.com/Drew-Opexcell/judge-lottery and are archived at https://doi.org/10.5281/zenodo.21392341.
References
Government Accountability Office. 2017. Social Security Disability: Additional Measures and Evaluation Needed to Enhance Accuracy and Consistency of Hearings Decisions. GAO-18-37. Washington, DC.
Krent, Harold J., and Scott Morris. 2013. Achieving Greater Consistency in Social Security Disability Adjudication: An Empirical Study and Suggested Reforms. Report to the Administrative Conference of the United States.
Ramji-Nogales, Jaya, Andrew I. Schoenholtz, and Philip G. Schrag. 2007. "Refugee Roulette: Disparities in Asylum Adjudication." Stanford Law Review 60 (2): 295-411.
Social Security Administration. 2025-2026. ALJ Disposition Data; Hearing Office Workload Data; Hearing Office Average Processing Time Report; State Agency Monthly Workload Data. Public data files, ssa.gov.